This piece is long so here are the key takeaways up front:
China’s hydropower installed base the largest in the world and is not just a substantial share of power generation in China, but globally.
It is like most renewables somewhat variable and subject to the vagaries of weather and has been particularly so the last two years with very weak rainfall and low output. Hydro capacity utilization (utilization hours) can swing much more violently over longer periods than wind and solar - it was down 25% at one point in July or in overall generation share terms it went from ~17% to 13% of total generation.
Hydropower is a major driver of Chinese imports of coal and gas due to China’s grid topology. The provinces in China that are part of the Southern Grid do not have substantial coal resources of their own and their imports swing wildly based upon hydro power performance.
Rainfall has picked up materially recently and China’s hydropower output based upon current and forecast weather is likely to improve a great deal.
The implication here is that China has built a large stockpile of coal recently just as the weather turned implying much weaker fossil import demand until the weather changes again or those inventories are worked off.
This is why China’s thermal power generation likely peaked in 2023 - a return of normalized hydropower output combined with continued brisk install rates of renewables and slower industrial output imply that there isn’t enough growth in power demand to go around for thermal to grow anymore.
China’s Hydropower Sector Size in Global Context
China’s hydropower sector is the largest in the world by a significant margin as can be seen below.
India is large and growing too but China is here now. Annual hydropower output in China has been around 1000 TWh per year for the last few years which translates to 4% of global electricity output.
Looking at a plot of output by province monthly you can a few things. Firstly, output is dominated by a few provinces - Sichuan, Yunnan and down river of those two, Hubei. The rest are comparatively a rounding error.
It is hard to pick out with the seasonality above but looking at a seasonality decomposition for the above the picture is more clear. Blue represents the trend, orange seasonality and residuals in green. After steady growth things fell apart for aggregate output in 2022 particularly in Hubei and Yunnan.
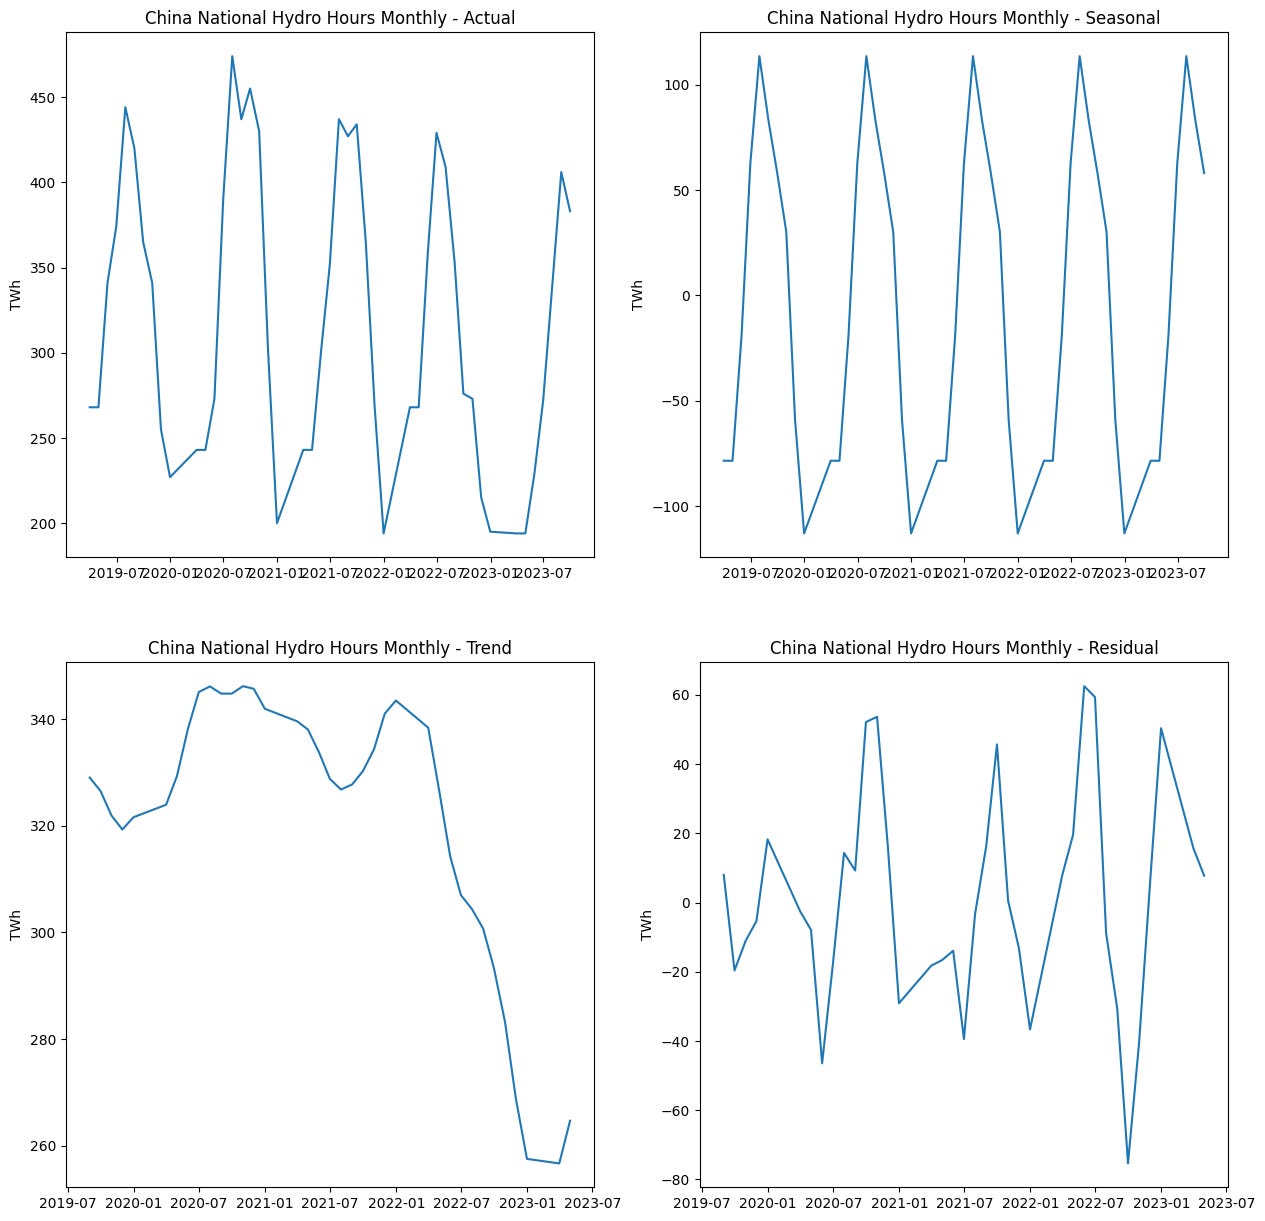
The data is even more striking when you look at the utilization hours of hydro - how many hours of use you get for all the hydro capacity China has.
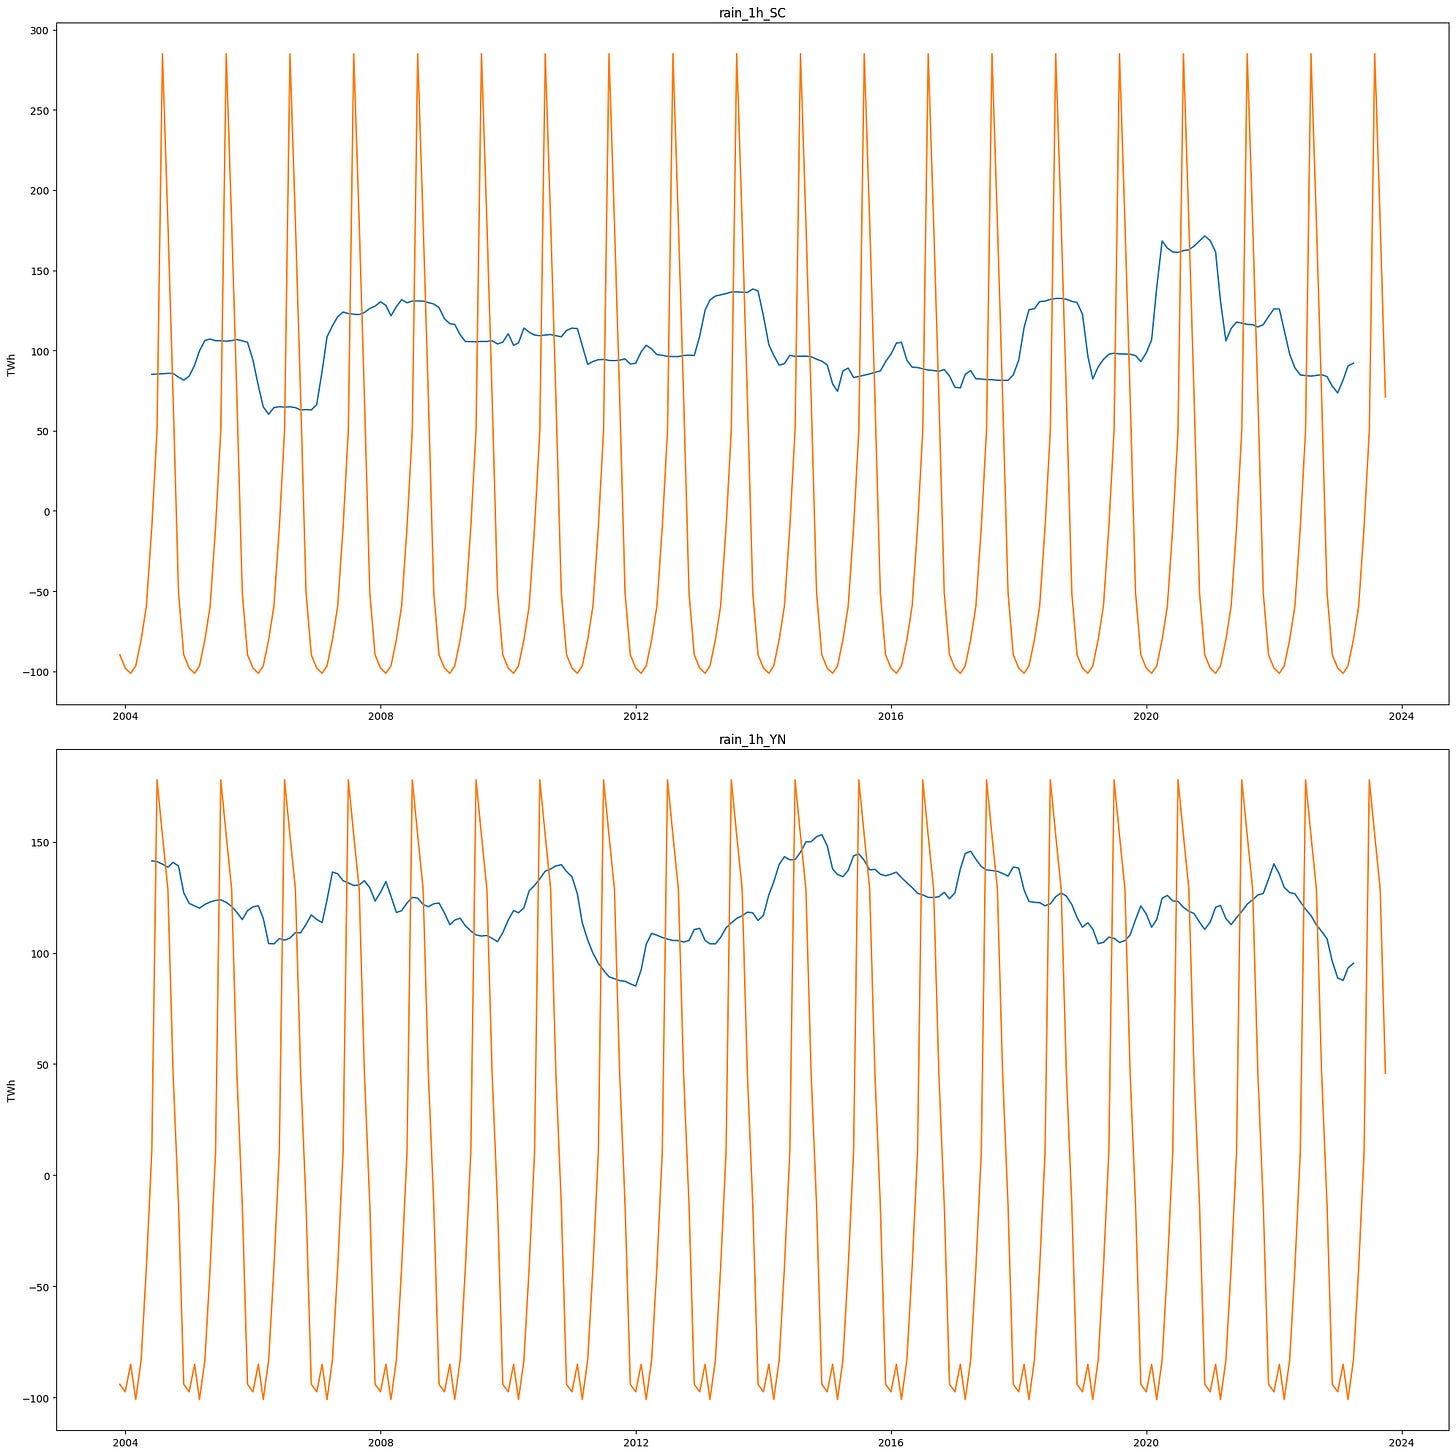
The trend term completely collapsed from mid 2022. This was due to weather and in particular a combination of a very hot summer in Eastern China and and very weak rainfall in Sichuan and Yunnan that you can see below. I have a longer dataset for this and as you can see the seasonality of rain is strong but the weak trend (blue) is clear too. 2020 was strong but current levels of rainfall have been the lowest since 2011 especially in Yunnan though they have improved markedly recently.
So rainfall causes hydro output to go up - not a controversial finding, but can you predict hydro utilization hours from weather data? You can but it is a bit of an art because unlike purely physical phenomena there are the decisions made by China’s hydropower plant operators. I have some more granular data for the Three Gorges Dam from other sources and you can plot the net flow (water inflows minus outflows, both in cubic meters per second) versus the height of the dam’s upper reservoir above its lower reservoir a good proxy for power output using the potential energy equation for gravity (mass * gravitational constant * height).
There is a clear seasonal pattern here - let the “battery” drain down into the summer rains, recharge it and run the summer river flow and then store for the winter which is sensible and optimal and there is a massive literature on dynamic stochastic optimization: basically asking the question about how best to utilize hydro power given uncertain rainfall, power demand, and other energy sources. It is vastly more useful but related to the recently much maligned dynamic stochastic general equilibrium (DSGE) models in economics. Daniel Kuhn at EPFL wrote a good paper on this recently and there are some excellent open source contributions in Julia in particular from Austrian utilities and other hydro heavy girds. It is very interesting stuff but I am not wading into it here. The takeaway is that you can model the weather but modelling hydro strategy is harder.
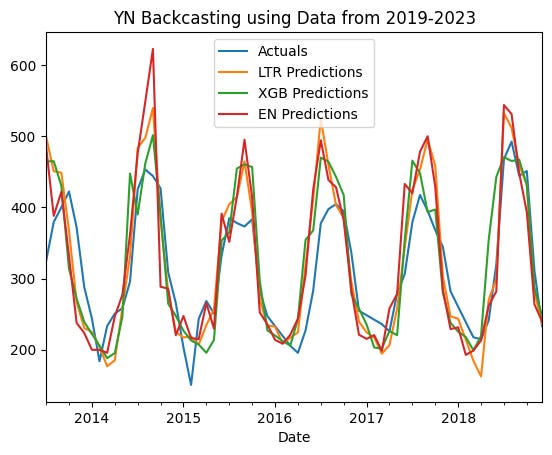
Forecasting data backwards and forward using weather data you get something like this when targeting Yunnan hydro hours - back cast data predicts bigger summer flows than there were, but using old data to forecast under predicts summer flows. All predictions made using Linear Tree Regressor, XGBoost and an Elastic Net.
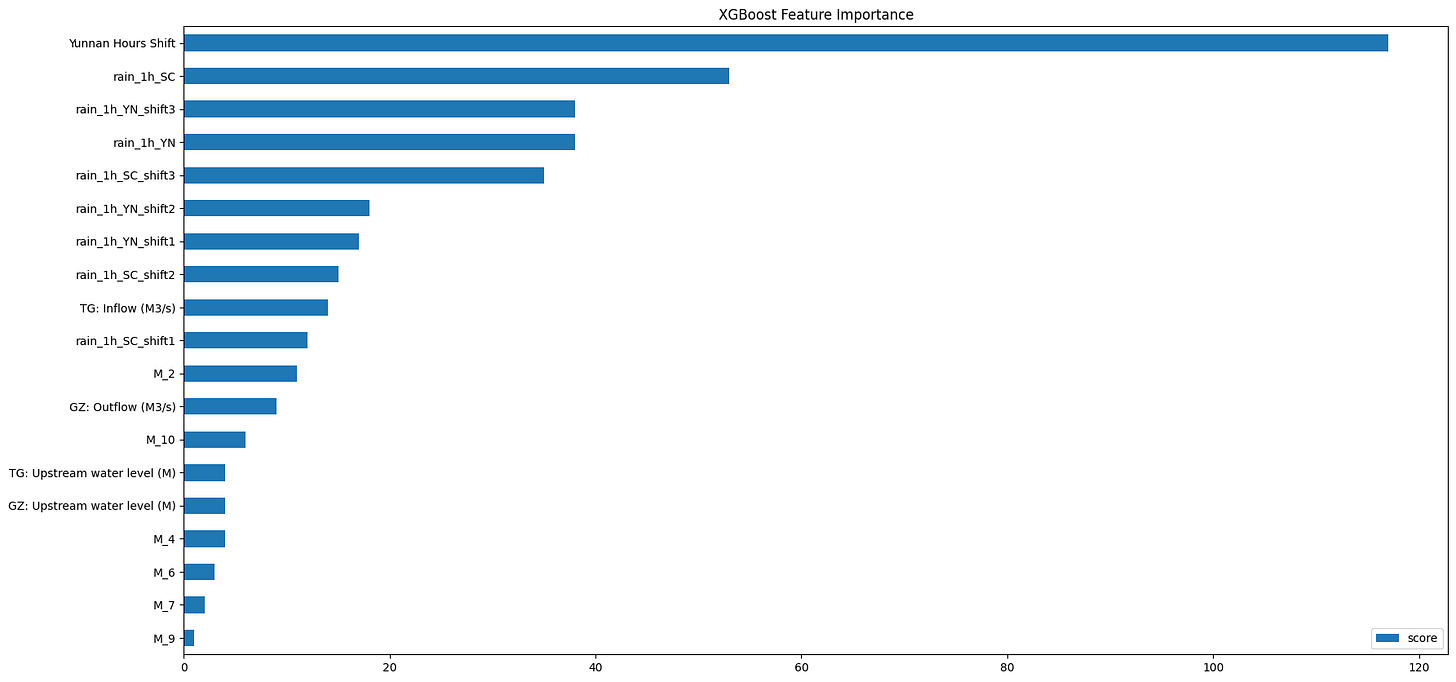
Adding in lagged hours solves this mostly though and looking at the XGBoost importances what matters is the prior months hours and rainfall.
So we can use weather data and China official data to get a very good estimate of hydro hours and thus hydro output - dam levels of key water bodies in the Yangzi River Basin are not that important. This is good because weather data is less likely to get pulled by a Chinese authority worrying about energy data security. A key part of doing any analysis in China is making your models not just statistically robust, but robust to getting the rug pulled on your input data.
What is also notable here is that the model is forecasting a massive return in hydro output which began in September and is continuing right now. Forecasts from the ECMWF models imply more wet weather inbound for December through March though forecasts out this far tend to be less accurate.
Why Hydro Matters - and Not Just in China
China’s hydro power output is heavily skewed to a number of Southwest provinces and undershot most of this year but recovered rapidly in August and September continuing into October.
Key river flow are all highly correlated but key reservoirs including the Three Gorges Dam have made a remarkable recovery now after a very bad 2022.
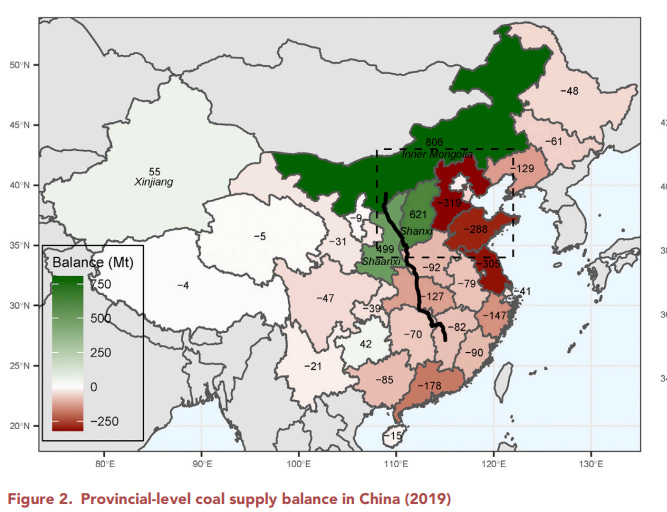
This matters because these Southern Provinces are connected to China Southern Grid whose provinces import most of the thermal coal imported into China. Image below from the Gosens-Turnbull-Jotzo paper.
A positive hydro shock at the margin acts as a demand reduction for coal but one whose impact is heaviest in the provinces that import the most foreign coal. For a range of coal growth scenarios at the national level we estimated which coal sources get squeezed out and the pain is mostly in the South. Given the hydro supply shock is in the South this is likely to be worse.
How big is this likely to be? Simply enormous - a normalization of hydro hours implies another ~440 TWh of output from hydro in 2024. China’s electricity output in 2022 was 8388 TWh. Even with a post COVID bounce to ~9000 that would be more than 4% of total output - combined with wind and solar expansions 2024 will need a massive increase in power for thermal power output to not decline and likely substantially. Given the location of the output increase the Indonesian coal sector is in for some lean times and China’s coal burn has likely peaked this year, which is something to celebrate. It is hard to see a deflating property bubble and slowing construction of housing and assorted energy intensive production going any other way. China’s other capital expenditure boom in clean energy will only drive this harder - offshore wind has not taken a backwards step in China.
Taking a further step back, China reducing its fossil imports represents another frontier for Chinese mercantilism, albeit something I am emphatically in favour of for environmental reasons. This will drive China’s trade surplus up and likely lead to a combination of much reduced fossil imports and lower fossil prices as well as China continuing to export its surplus production. Last week’s flip in the rates market is a sign of more to come: a decarbonizing China with much reduced fossil imports reducing price pressures in fuels but not stepping away from exporting goods as much as it can. This could we provide scope for tightening sanctions on Russian LNG as Chinese imports fall but more broadly this is a very deflationary fact pattern.








A fantastic research / analysis effort
Great research, Alex. I used to work in China’s hydropower industry. Another factor is snow melt off Tibetan plateau during summer months, biggest impact is in Yunnan, also Sichuan. Too much rain too fast can be bad as it gets released (wasted), instead of used by generators--so there’s a cap to usage ability based on water basin dams.